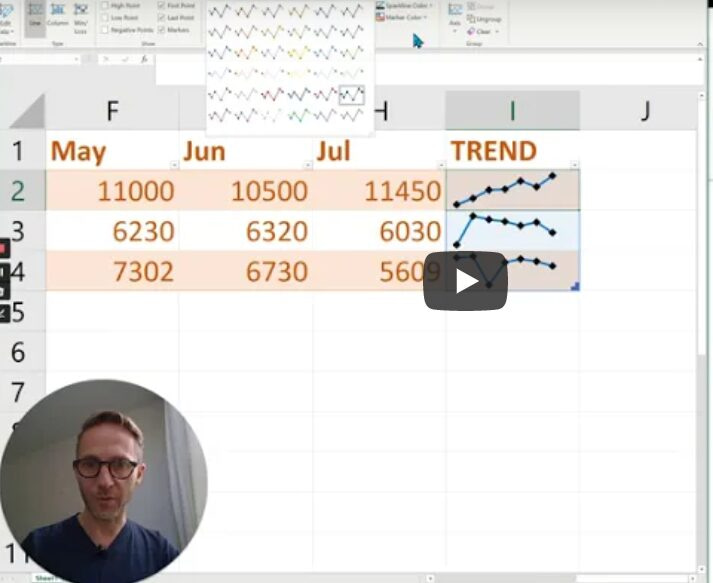
Sparklines are tiny charts that reside in a cell in Excel.
In just a few clicks it can really give a large table of data a “spark” and show the actual progression of data within a timeline.
Click here to subscribe to my YouTube channel.
Sparklines are tiny charts that reside in a cell in Excel.
In just a few clicks it can really give a large table of data a “spark” and show the actual progression of data within a timeline.
Click here to subscribe to my YouTube channel.